How Many Planned, How Many Completed?
You have made your diagnosis. You have told the patient what you feel is best for their health and well-being. And, being sensitive to their circumstances, you have presented several options. But the patient wants time to go home and think about it. Until they get back in the chair, there are two missed opportunities—their health and your revenue. For the financial health of your practice, it's important to track how well you are doing with case acceptance.
The Treatment Plan Statistics Analysis Report can be customized to compare the number of procedures treatment-planned during a specific time frame and the percentage of those treatment-planned procedures that were actually completed.
To generate the report:
-
From the Office Manager, in the Reports menu, click Management and then Treatment Plan Statistics Analysis. The Treatment Plan Statistics Analysis dialog box appears.
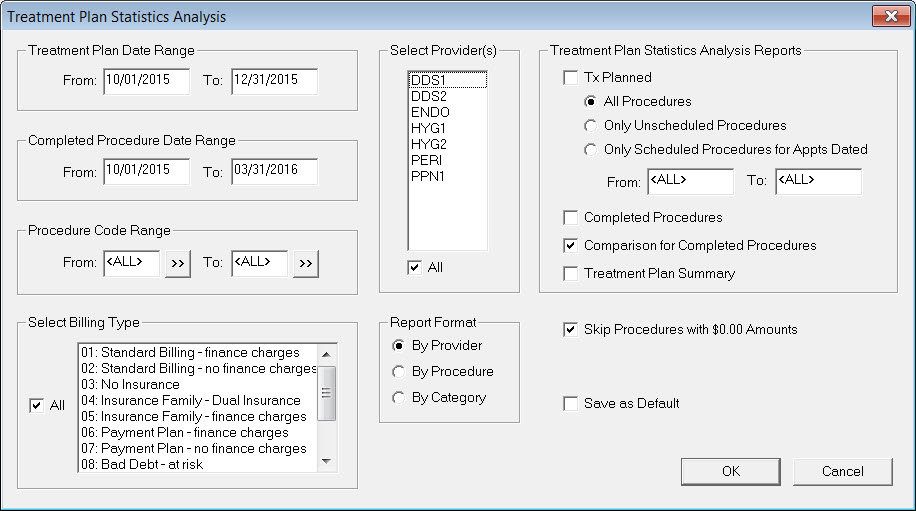
- The Treatment Plan Date Range is a span of dates in which procedures were treatment-planned for patients. In the Treatment Plan Date Range group box, enter the date range to include on the report using the From and To fields, or leave <ALL> entered in both fields to include treatment-planned procedures for all dates.
-
The Completed Procedure Date Range is a span of dates in which treatment-planned procedures were completed for patients. In the Completed Procedure Date Range group box, enter the date range to include on the report using the From and To fields, or leave <ALL> entered in both fields to include completed procedures for all dates.
Note: Treatment-planned procedures may take several months to complete. You may therefore consider, for example, setting the Treatment Plan Date Range from 10/01/15 to 12/31/15 and the Completed Procedure Date Range from 10/1/15 through 3/31/16.
- In the Procedure Code Range group box, select the range of procedure codes that you want to include on the report. Click the From search button to select the starting procedure code and the To search button to select the ending procedure code. Or, leave <ALL> selected in both fields to include all procedure codes.
- In the Select Billing Type group box, select the billing types you want to include or select All to include all billing types.
- In the Select Provider(s) group box, select the providers you want to include or select All to include all providers. The treatment-planned procedure numbers will reflect the provider assignments in the patient chart.
-
In the Report Format group box, select one of the following report format options:
- By Provider – Lists only the combined procedure information for each provider selected for the reports.
- By Procedure – Lists all applicable procedure codes with information for each.
- By Category – Lists all applicable categories with the combined information for all procedures within each procedure code category.
-
The Treatment Plan Statistics Analysis Reports group box offers several report options. To see the comparison of treatment-planned procedures to completed procedures, select Comparison for Completed Procedures.
-
When this option is checked, the Completed Procedure Date Range group box becomes active. Set the From and To dates to include in the report or leave <ALL> entered in both fields to include completed treatment-planned procedures for all dates.
Tip: Try running the report with different completed procedure date ranges to help you get a better idea of how long it takes to actually move planned treatment to completed treatment.
-
When this option is checked, the Completed Procedure Date Range group box becomes active. Set the From and To dates to include in the report or leave <ALL> entered in both fields to include completed treatment-planned procedures for all dates.
- If you do not want any procedures with the amount of zero to be included on the report, select Skip Procedures With $0.00 Amounts.
- To save your settings for the next time you generate the report, select Save as Default.
-
Click OK to send the report to the Batch Processor, where it will show up with the description “Treatment Plan Statistics Analysis – Comparison.”
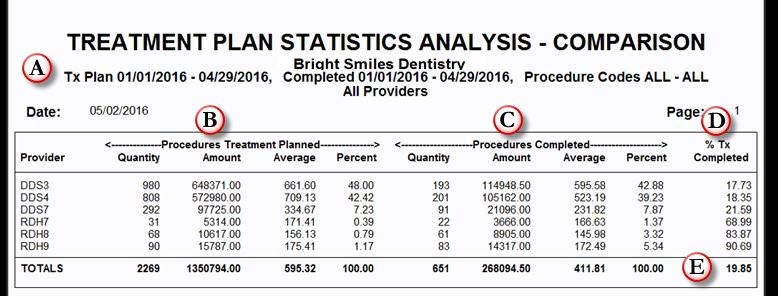


The Treatment Plan Statistics Analysis – Comparison Report consists of the following information (this example is formatted By Provider):
- The report selection or filter criteria.
- Procedures Treatment Planned – This section displays the number, total value, average value and percentage (by amount) of treatment plans in the report that were posted for each provider.
- Procedures Completed – This section displays the number, total value and average value of completed procedures with the percentage (by amount) of completed procedures that were posted by each provider.
- % Tx Completed – This section displays the percentage of completed treatment plans by amount, which is the number of Procedures Completed (letter C) divided by the number of Procedures Treatment Planned (letter B).
- Totals – This section displays the combined totals for all providers.
For more information on how to generate this report, see the Treatment Plan Statistics Analysis topic in the Dentrix Help or log in to the Dentrix Resource Center and search for knowledgebase article # 22856 titled Treatment Plan Statistics Analysis Report.
Author: Joel Baldwin, Curriculum Development Supervisor
Published: 05/31/2016

 Contact Us
 Phone:
  Email
Email Request Demo